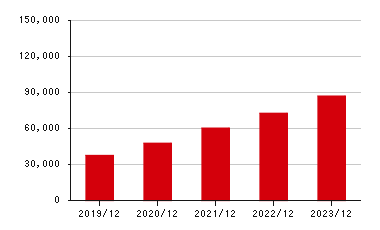
Financial Highlights
(Million yen)
| 2021/12 |
2022/12 |
2023/12 |
2024/12 |
2025/12 |
|
|---|---|---|---|---|---|
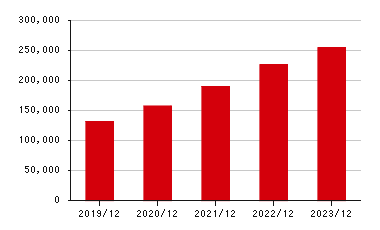
| Net sales | 189,731 | 225,970 | 254,286 | 288,119 | 333,880 |
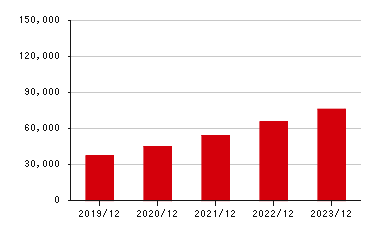
| Gross profit | 54,045 | 65,437 | 75,964 | 84,420 | 99,636 |
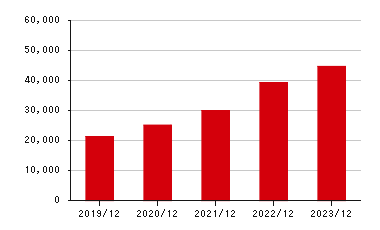
| Selling, general and administrative expenses | 29,916 | 39,224 | 44,654 | 47,353 | 53,443 |
| Operating profit | 24,129 | 26,213 | 31,309 | 37,066 | 46,192 |
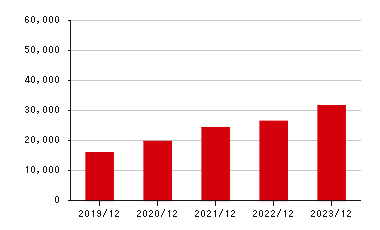
| Ordinary profit | 24,302 | 26,398 | 31,538 | 37,320 | 46,057 |
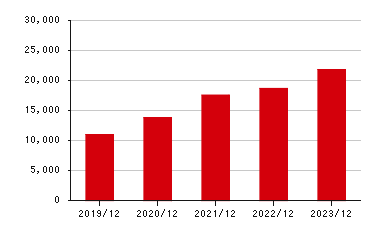
| Profit attributable to owners of parent | 17,552 | 18,658 | 21,813 | 26,338 | 32,434 |
| Total assets | 95,789 | 111,737 | 128,352 | 145,028 | 193,243 |
| Net assets | 60,283 | 72,621 | 86,982 | 104,267 | 122,933 |
Net sales
Gross profit
Selling, general and administrative expenses
Operating profit
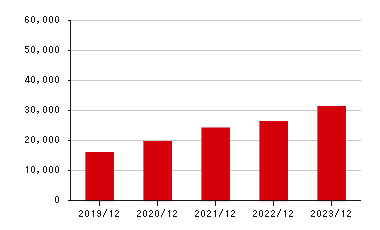
Ordinary profit
Profit attributable to owners of parent
Total assets
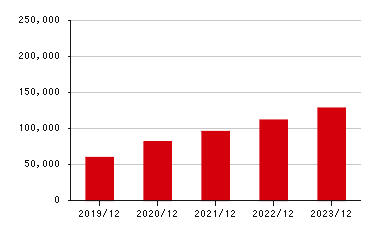
Net assets
